Logstash
The OP5 Log Analytics use Logstash service to dynamically unify data from disparate sources and normalize the data into destination of your choose. A Logstash pipeline has two required elements, input and output, and one optional element filter. The input plugins consume data from a source, the filter plugins modify the data as you specify, and the output plugins write the data to a destination. The default location of the Logstash plugin files is: /etc/logstash/conf.d/. This location contain following OP5
Log Analytics default plugins:
01-input-beats.conf01-input-syslog.conf020-filter-beats-syslog.conf020-filter-network.conf099-filter-geoip.conf100-output-elasticsearch.confnaemon_beat.exampleperflogs.example
Logstash - Input “beats”
This plugin wait for receiving data from remote beats services. It use tcp /5044 port for communication:
            input {
                    beats {
                            port => 5044
                    }
            }
Logstash - Input “network”
This plugin read events over a TCP or UDP socket assigns the appropriate tags:
	input {
	        tcp {
	                port => 5514
	                type => "network"

	                tags => [ "LAN", "TCP" ]
	        }

	        udp {
	                port => 5514
	                type => "network"

	                tags => [ "LAN", "UDP" ]
	        }
	}
Logstash - Filter “beats syslog”
This filter processing an event data with syslog type:
	filter {

	 if [type] == "syslog" {
			grok {
					match => {
					  "message" => [
					# auth: ssh|sudo|su

					  "%{SYSLOGTIMESTAMP:[system][auth][timestamp]} %{SYSLOGHOST:[system][auth][hostname]} sshd(?:\[%{POSINT:[system][auth][pid]}\])?: %{DATA:[system][auth][ssh][event]} %{DATA:[system][auth][ssh][method]} for (invalid user )?%{DATA:[system][auth][user]} from %{IPORHOST:[system][auth][ssh][ip]} port %{NUMBER:[system][auth][ssh][port]} ssh2(: %{GREEDYDATA:[system][auth][ssh][signature]})?",

							  "%{SYSLOGTIMESTAMP:[system][auth][timestamp]} %{SYSLOGHOST:[system][auth][hostname]} sshd(?:\[%{POSINT:[system][auth][pid]}\])?: %{DATA:[system][auth][ssh][event]} user %{DATA:[system][auth][user]} from %{IPORHOST:[system][auth][ssh][ip]}",

							  "%{SYSLOGTIMESTAMP:[system][auth][timestamp]} %{SYSLOGHOST:[system][auth][hostname]} sshd(?:\[%{POSINT:[system][auth][pid]}\])?: Did not receive identification string from %{IPORHOST:[system][auth][ssh][dropped_ip]}",

							  "%{SYSLOGTIMESTAMP:[system][auth][timestamp]} %{SYSLOGHOST:[system][auth][hostname]} sudo(?:\[%{POSINT:[system][auth][pid]}\])?: \s*%{DATA:[system][auth][user]} :( %{DATA:[system][auth][sudo][error]} ;)? TTY=%{DATA:[system][auth][sudo][tty]} ; PWD=%{DATA:[system][auth][sudo][pwd]} ; USER=%{DATA:[system][auth][sudo][user]} ; COMMAND=%{GREEDYDATA:[system][auth][sudo][command]}",

							  "%{SYSLOGTIMESTAMP:[system][auth][timestamp]} %{SYSLOGHOST:[system][auth][hostname]} %{DATA:[system][auth][program]}(?:\[%{POSINT:[system][auth][pid]}\])?: %{GREEDYMULTILINE:[system][auth][message]}",

					# add/remove user or group
							  "%{SYSLOGTIMESTAMP:[system][auth][timestamp]} %{SYSLOGHOST:[system][auth][hostname]} groupadd(?:\[%{POSINT:[system][auth][pid]}\])?: new group: name=%{DATA:system.auth.groupadd.name}, GID=%{NUMBER:system.auth.groupadd.gid}",

					  "%{SYSLOGTIMESTAMP:[system][auth][timestamp]} %{SYSLOGHOST:[system][auth][hostname]} userdel(?:\[%{POSINT:[system][auth][pid]}\])?: removed group '%{DATA:[system][auth][groupdel][name]}' owned by '%{DATA:[system][auth][group][owner]}'",

							  "%{SYSLOGTIMESTAMP:[system][auth][timestamp]} %{SYSLOGHOST:[system][auth][hostname]} useradd(?:\[%{POSINT:[system][auth][pid]}\])?: new user: name=%{DATA:[system][auth][user][add][name]}, UID=%{NUMBER:[system][auth][user][add][uid]}, GID=%{NUMBER:[system][auth][user][add][gid]}, home=%{DATA:[system][auth][user][add][home]}, shell=%{DATA:[system][auth][user][add][shell]}$",

					   "%{SYSLOGTIMESTAMP:[system][auth][timestamp]} %{SYSLOGHOST:[system][auth][hostname]} userdel(?:\[%{POSINT:[system][auth][pid]}\])?: delete user '%{WORD:[system][auth][user][del][name]}'$",

					   "%{SYSLOGTIMESTAMP:[system][auth][timestamp]} %{SYSLOGHOST:[system][auth][hostname]} usermod(?:\[%{POSINT:[system][auth][pid]}\])?: add '%{WORD:[system][auth][user][name]}' to group '%{WORD:[system][auth][user][memberof]}'",

					   # yum install/erase/update package
					   "%{SYSLOGTIMESTAMP:[system][auth][timestamp]} %{DATA:[system][package][action]}: %{NOTSPACE:[system][package][name]}"
					]

				}

					pattern_definitions => {
					  "GREEDYMULTILINE"=> "(.|\n)*"
					}
				  }

				date {
						match => [ "[system][auth][timestamp]",
						"MMM  d HH:mm:ss",
					"MMM dd HH:mm:ss"
					]
					target => "[system][auth][timestamp]"
				}

				mutate {
				  convert => { "[system][auth][pid]" => "integer" }
				  convert => { "[system][auth][groupadd][gid]" => "integer" }
				  convert => { "[system][auth][user][add][uid]" => "integer" }
				  convert => { "[system][auth][user][add][gid]" => "integer" }
				}
	  }
	}
Logstash Filter “network”
This filter processing an event data with network type:
filter {
 if [type] == "network" {
     grok {
		named_captures_only => true
		match => {
			"message" => [

			# Cisco Firewall
			"%{SYSLOG5424PRI}%{NUMBER:log_sequence#}:%{SPACE}%{IPORHOST:device_ip}: (?:.)?%{CISCOTIMESTAMP:log_data} CET: %%{CISCO_REASON:facility}-%{INT:severity_level}-%{CISCO_REASON:facility_mnemonic}:%{SPACE}%{GREEDYDATA:event_message}",

			# Cisco Routers
			"%{SYSLOG5424PRI}%{NUMBER:log_sequence#}:%{SPACE}%{IPORHOST:device_ip}: (?:.)?%{CISCOTIMESTAMP:log_data} CET: %%{CISCO_REASON:facility}-%{INT:severity_level}-%{CISCO_REASON:facility_mnemonic}:%{SPACE}%{GREEDYDATA:event_message}",

			# Cisco Switches
			"%{SYSLOG5424PRI}%{NUMBER:log_sequence#}:%{SPACE}%{IPORHOST:device_ip}: (?:.)?%{CISCOTIMESTAMP:log_data} CET: %%{CISCO_REASON:facility}-%{INT:severity_level}-%{CISCO_REASON:facility_mnemonic}:%{SPACE}%{GREEDYDATA:event_message}",
			"%{SYSLOG5424PRI}%{NUMBER:log_sequence#}:%{SPACE}(?:.)?%{CISCOTIMESTAMP:log_data} CET: %%{CISCO_REASON:facility}-%{INT:severity_level}-%{CISCO_REASON:facility_mnemonic}:%{SPACE}%{GREEDYDATA:event_message}",

			# HP switches
			"%{SYSLOG5424PRI}%{SPACE}%{CISCOTIMESTAMP:log_data} %{IPORHOST:device_ip} %{CISCO_REASON:facility}:%{SPACE}%{GREEDYDATA:event_message}"
			]

		}
	}

	syslog_pri { }

	if [severity_level] {

	  translate {
	    dictionary_path => "/etc/logstash/dictionaries/cisco_syslog_severity.yml"
	    field => "severity_level"
	    destination => "severity_level_descr"
	  }

	}

	if [facility] {

	  translate {
	    dictionary_path => "/etc/logstash/dictionaries/cisco_syslog_facility.yml"
	    field => "facility"
	    destination => "facility_full_descr"
	  }

	}

	 #ACL
	 if [event_message] =~ /(\d+.\d+.\d+.\d+)/ {
	  grok {
	    match => {
		"event_message" => [
			"list %{NOTSPACE:[acl][name]} %{WORD:[acl][action]} %{WORD:[acl][proto]} %{IP:[src][ip]}.*%{IP:[dst][ip]}",
			"list %{NOTSPACE:[acl][name]} %{WORD:[acl][action]} %{IP:[src][ip]}",
			"^list %{NOTSPACE:[acl][name]} %{WORD:[acl][action]} %{WORD:[acl][proto]} %{IP:[src][ip]}.*%{IP:[dst][ip]}"
			]
	    }
	  }
	}

	if [src][ip] {

		cidr {
		   address => [ "%{[src][ip]}" ]
		   network => [ "0.0.0.0/32", "10.0.0.0/8", "172.16.0.0/12", "192.168.0.0/16", "fc00::/7", "127.0.0.0/8", "::1/128", "169.254.0.0/16", "fe80::/10","224.0.0.0/4", "ff00::/8","255.255.255.255/32"  ]
		   add_field => { "[src][locality]" => "private" }
		}

		if ![src][locality] {
		   mutate {
		      add_field => { "[src][locality]" => "public" }
		   }
		}
	}


	if [dst][ip] {
		cidr {
		   address => [ "%{[dst][ip]}" ]
		   network => [ "0.0.0.0/32", "10.0.0.0/8", "172.16.0.0/12", "192.168.0.0/16", "fc00::/7", "127.0.0.0/8", "::1/128",
				"169.254.0.0/16", "fe80::/10","224.0.0.0/4", "ff00::/8","255.255.255.255/32" ]
		   add_field => { "[dst][locality]" => "private" }
		}

		if ![dst][locality] {
		   mutate {
		      add_field => { "[dst][locality]" => "public" }
		   }
		}
	}

	# date format
	date {
	  match => [ "log_data",
		"MMM dd HH:mm:ss",
		"MMM  dd HH:mm:ss",
		"MMM dd HH:mm:ss.SSS",
		"MMM  dd HH:mm:ss.SSS",
		"ISO8601"
	  ]
	  target => "log_data"
	}

 }
}
Logstash - Filter “geoip”
This filter processing an events data with IP address and check localization:
filter {
     if [src][locality] == "public" {

		geoip {
			source => "[src][ip]"
			target => "[src][geoip]"
			database => "/etc/logstash/geoipdb/GeoLite2-City.mmdb"
			fields => [ "city_name", "country_name", "continent_code", "country_code2", "location" ]
			remove_field => [ "[src][geoip][ip]" ]
		}

		geoip {
			source => "[src][ip]"
			target => "[src][geoip]"
			database => "/etc/logstash/geoipdb/GeoLite2-ASN.mmdb"
			remove_field => [ "[src][geoip][ip]" ]
		}

     }

     if [dst][locality] == "public" {

		geoip {
			source => "[dst][ip]"
			target => "[dst][geoip]"
			database => "/etc/logstash/geoipdb/GeoLite2-City.mmdb"
			fields => [ "city_name", "country_name", "continent_code", "country_code2", "location" ]
			remove_field =>  [ "[dst][geoip][ip]" ]
		}

		geoip {
			source => "[dst][ip]"
			target => "[dst][geoip]"
			database => "/etc/logstash/geoipdb/GeoLite2-ASN.mmdb"
			remove_field => [ "[dst][geoip][ip]" ]
		}
     }

}
Logstash - Output to Elasticsearch
This output plugin sends all data to the local Elasticsearch instance and create indexes:
output {
	elasticsearch {
	   hosts => [ "127.0.0.1:9200" ]

	   index => "%{type}-%{+YYYY.MM.dd}"

	   user => "logstash"
	   password => "logstash"
	}
}
Logstash pluging for “naemon beat”
This Logstash plugin has example of complete configuration for integration with naemon application:
input {
    beats {
        port => FILEBEAT_PORT
        type => "naemon"
    }
}

filter {
    if [type] == "naemon" {
        grok {
            patterns_dir => [ "/etc/logstash/patterns" ]
            match => { "message" => "%{NAEMONLOGLINE}" }
            remove_field => [ "message" ]
        }
        date {
            match => [ "naemon_epoch", "UNIX" ]
            target => "@timestamp"
            remove_field => [ "naemon_epoch" ]
        }
    }
}

output {
    # Single index
#    if [type] == "naemon" {
#        elasticsearch {
#            hosts => ["ELASTICSEARCH_HOST:ES_PORT"]
#            index => "naemon-%{+YYYY.MM.dd}"
#        }
#    }

    # Separate indexes
    if [type] == "naemon" {
        if "_grokparsefailure" in [tags] {
            elasticsearch {
                hosts => ["ELASTICSEARCH_HOST:ES_PORT"]
                index => "naemongrokfailure"
            }
        }
        else {
            elasticsearch {
                hosts => ["ELASTICSEARCH_HOST:ES_PORT"]
                index => "naemon-%{+YYYY.MM.dd}"
            }
        }
    }
}
Logstash pluging for “perflog”
This Logstash plugin has example of complete configuration for integration with perflog:
input {
  tcp {
    port => 6868
    host => "0.0.0.0"
    type => "perflogs"
  }
}

filter {
  if [type] == "perflogs" {
    grok {
      break_on_match => "true"
      match => {
        "message" => [
          "DATATYPE::%{WORD:datatype}\tTIMET::%{NUMBER:timestamp}\tHOSTNAME::%{DATA:hostname}\tSERVICEDESC::%{DATA:servicedescription}\tSERVICEPERFDATA::%{DATA:performance}\tSERVICECHECKCOMMAND::.*?HOSTSTATE::%{WORD:hoststate}\tHOSTSTATETYPE::.*?SERVICESTATE::%{WORD:servicestate}\tSERVICESTATETYPE::%{WORD:servicestatetype}",
          "DATATYPE::%{WORD:datatype}\tTIMET::%{NUMBER:timestamp}\tHOSTNAME::%{DATA:hostname}\tHOSTPERFDATA::%{DATA:performance}\tHOSTCHECKCOMMAND::.*?HOSTSTATE::%{WORD:hoststate}\tHOSTSTATETYPE::%{WORD:hoststatetype}"
          ]
        }
      remove_field => [ "message" ]
    }
    kv {
      source => "performance"
      field_split => "\t"
      remove_char_key => "\.\'"
      trim_key => " "
      target => "perf_data"
      remove_field => [ "performance" ]
      allow_duplicate_values => "false"
      transform_key => "lowercase"
    }
    date {
      match => [ "timestamp", "UNIX" ]
      target => "@timestamp"
      remove_field => [ "timestamp" ]
    }
  }
}

output {
  if [type] == "perflogs" {
    elasticsearch {
      hosts => ["127.0.0.1:9200"]
      index => "perflogs-%{+YYYY.MM.dd}"
    }
  }
}
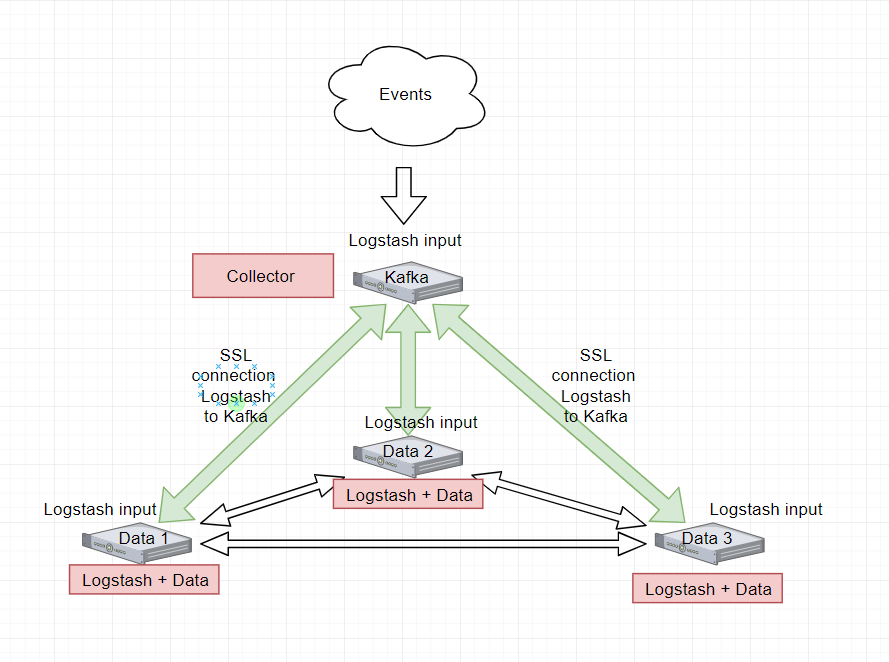
Enabling encryption
Kafka allows you to distribute the load between nodes receiving data and encrypts communication.
Architecture example:
The Kafka installation
Documentation during creation.
Enabling encryption in Kafka
Generate SSL key and certificate for each Kafka broker
keytool -keystore server.keystore.jks -alias localhost -validity {validity} -genkey -keyalg RSA
Configuring Host Name In Certificates
keytool -keystore server.keystore.jks -alias localhost -validity {validity} -genkey -keyalg RSA -ext SAN=DNS:{FQDN}
Verify content of the generated certificate:
keytool -list -v -keystore server.keystore.jks
Creating your own CA
openssl req -new -x509 -keyout ca-key -out ca-cert -days 365
keytool -keystore client.truststore.jks -alias CARoot -import -file ca-cert
keytool -keystore server.truststore.jks -alias CARoot -import -file ca-cert
Signing the certificate
keytool -keystore server.keystore.jks -alias localhost -certreq -file cert-file
openssl x509 -req -CA ca-cert -CAkey ca-key -in cert-file -out cert-signed -days {validity} -CAcreateserial -passin pass:{ca-password}
Import both the certificate of the CA and the signed certificate into the keystore
keytool -keystore server.keystore.jks -alias CARoot -import -file ca-cert
keytool -keystore server.keystore.jks -alias localhost -import -file cert-signed
Configuring Kafka Brokers
In /etc/kafka/server.properties file set the following options:
listeners=PLAINTEXT://host.name:port,SSL://host.name:port

ssl.keystore.location=/var/private/ssl/server.keystore.jks
ssl.keystore.password=test1234
ssl.key.password=test1234
ssl.truststore.location=/var/private/ssl/server.truststore.jks
ssl.truststore.password=test1234
and restart the Kafka service
systemctl restart kafka
Configuring Kafka Clients
Logstash
Configure the output section in Logstash based on the following example:
output {
  kafka {
    bootstrap_servers => "host.name:port"
    security_protocol => "SSL"
    ssl_truststore_type => "JKS"
    ssl_truststore_location => "/var/private/ssl/client.truststore.jks"
    ssl_truststore_password => "test1234"
    client_id => "host.name"
    topic_id => "Topic-1"
    codec => json
  }
}
Configure the input section in Logstash based on the following example:
input {
  kafka {
    bootstrap_servers => "host.name:port"
    security_protocol => "SSL"
    ssl_truststore_type => "JKS"
    ssl_truststore_location => "/var/private/ssl/client.truststore.jks"
    ssl_truststore_password => "test1234"
    consumer_threads => 4
    topics => [ "Topic-1" ]
    codec => json
    tags => ["kafka"]
   }
}