Integrations
Setting up Naemon logs
Logstash
- In
op5naemon_beat.confset upELASTICSEARCH_HOST,ES_PORT,FILEBEAT_PORT - Copy
op5naemon_beat.confto/etc/logstash/conf.d - Based on “FILEBEAT_PORT” if firewall is running:
sudo firewall-cmd --zone=public --permanent --add-port=FILEBEAT_PORT/tcp
sudo firewall-cmd --reload
- Based on amount of data that elasticsearch will receive you can also choose whether you want index creation to be based on moths or days:
index => "op5-naemon-%{+YYYY.MM}"
or
index => "op5-naemon-%{+YYYY.MM.dd}"
- Copy
naemonfile to /etc/logstash/patterns and make sure it is readable by logstash process - Restart logstash configuration e.g.:
sudo systemct restart logstash
Elasticsearch
- Connect to Elasticsearch node via SSH and Install index pattern for naemon logs. Note that if you have a default pattern covering settings section you should delete/modify that in naemon_template.sh:
  "settings": {
    "number_of_shards": 5,
    "auto_expand_replicas": "0-1"
  },
- Install template by running:
./naemon_template.sh
OP5 Monitor
On OP5 Monitor host install filebeat (for instance via rpm
https://www.elastic.co/downloads/beats/filebeat)In
/etc/filebeat/filebeat.ymladd:#=========================== Filebeat inputs ============================= filebeat.config.inputs: enabled: true path: configs/*.yml
You also will have to configure the output section in
filebeat.yml. You should have one logstash output:#----------------------------- Logstash output -------------------------------- output.logstash: # The Logstash hosts hosts: ["LOGSTASH_IP:FILEBEAT_PORT"]
If you have few logstash instances -
Logstashsection has to be repeated on every node andhosts:should point to all of them:hosts: ["LOGSTASH_IP:FILEBEAT_PORT", "LOGSTASH_IP:FILEBEAT_PORT", "LOGSTASH_IP:FILEBEAT_PORT" ]
Create
/etc/filebeat/configscatalog.Copy
naemon_logs.ymlto a newly created catalog.Check the newly added configuration and connection to logstash. Location of executable might vary based on os:
 /usr/share/filebeat/bin/filebeat --path.config /etc/filebeat/ test config
 /usr/share/filebeat/bin/filebeat --path.config /etc/filebeat/ test output
Restart filebeat:
 sudo systemctl restart filebeat # RHEL/CentOS 7
 sudo service filebeat restart # RHEL/CentOS 6
Elasticsearch
At this moment there should be a new index on the Elasticsearch node:
curl -XGET '127.0.0.1:9200/_cat/indices?v'
Example output:
	health status index                 uuid                   pri rep docs.count docs.deleted store.size pri.store.size
	green  open   op5-naemon-2018.11    gO8XRsHiTNm63nI_RVCy8w   1   0      23176            0      8.3mb          8.3mb
If the index has been created, in order to browse and visualise the data, “index pattern” needs to be added in Kibana.
Sending OP5 performance data to Elasticsearch node
Below instruction requires that between OP5 node and Elasticsearch node is working Logstash instance.
Elasticsearch
First, settings section in op5template.sh should be adjusted, either:
there is a default template present on Elasticsearch that already covers shards and replicas then settings sections should be removed from the op5template.sh before executing
there is no default template - shards and replicas should be adjusted for you environment (keep in mind replicas can be added later, while changing shards count on existing index requires reindexing it)
  "settings": {
    "number_of_shards": 5,
    "number_of_replicas": 0
  }
In URL op5perfdata is a name for the template - later it can be search for or modify with it.
The “template” is an index pattern. New indices matching it will have the settings and mapping applied automatically (change it if you index name for op5 perfdata is different).
Mapping name should match documents type:
 "mappings": {
   "op5perflogs"
Running op5template.sh will create a template (not index) for OP5 perf data documents.
Logstash
The op5perflogs.conf contains example of input/filter/output configuration. It has to be copied to /etc/logstash/conf.d/. Make sure that the logstash has permissions to read the configuration files:
chmod 664 /etc/logstash/conf.d/op5perflogs.conf
In the input section comment/uncomment “beats” or “tcp” depending on preference (beats if Filebeat will be used and tcp if NetCat). The port and the type has to be adjusted as well:
 port => PORT_NUMBER
 type => "op5perflogs"
In a filter section type has to be changed if needed to match the input section and Elasticsearch mapping.
In an output section type should match with the rest of a config. host should point to your elasticsearch node. index name should correspond with what has been set in elasticsearch template to allow mapping application. The date for index rotation in its name is recommended and depending on the amount of data expecting to be transferred should be set to daily (+YYYY.MM.dd) or monthly (+YYYY.MM) rotation:
 hosts => ["127.0.0.1:9200"]
 index => "op5-perflogs-%{+YYYY.MM.dd}"
Port has to be opened on a firewall:
 sudo firewall-cmd --zone=public --permanent --add-port=PORT_NUMBER/tcp
 sudo firewall-cmd --reload
Logstash has to be reloaded:
sudo systemctl restart logstash
or
sudo kill -1 LOGSTASH_PID
OP5 Monitor
You have to decide wether FileBeat or NetCat will be used. In case of Filebeat - skip to the second step. Otherwise:
Comment line:
  54    open(my $logFileHandler, '>>', $hostPerfLogs) or die "Could not open $hostPerfLogs"; #FileBeat
  •	Uncomment lines:
  55 #    open(my $logFileHandler, '>', $hostPerfLogs) or die "Could not open $hostPerfLogs"; #NetCat
  ...
  88 #    my $logstashIP = "LOGSTASH_IP";
  89 #    my $logstashPORT = "LOGSTASH_PORT";
  90 #    if (-e $hostPerfLogs) {
  91 #        my $pid1 = fork();
  92 #        if ($pid1 == 0) {
  93 #            exec("/bin/cat $hostPerfLogs | /usr/bin/nc -w 30 $logstashIP $logstashPORT");
  94 #        }
  95 #    }
In process-service-perfdata-log.pl and process-host-perfdata-log.pl: change logstash IP and port:
  92 my $logstashIP = "LOGSTASH_IP";
  93 my $logstashPORT = "LOGSTASH_PORT";
In case of running single op5 node, there is no problem with the setup. In case of a peered environment $do_on_host variable has to be set up and the script process-service-perfdata-log.pl/process-host-perfdata-log.pl has to be propagated on all of OP5 nodes:
 16 $do_on_host = "EXAMPLE_HOSTNAME"; # op5 node name to run the script on
 17 $hostName = hostname; # will read hostname of a node running the script
Example of command definition (/opt/monitor/etc/checkcommands.cfg) if scripts have been copied to /opt/plugins/custom/:
 # command 'process-service-perfdata-log'
 define command{
     command_name                   process-service-perfdata-log
     command_line                   /opt/plugins/custom/process-service-perfdata-log.pl $TIMET$
     }
 # command 'process-host-perfdata-log'
 define command{
     command_name                   process-host-perfdata-log
     command_line                   /opt/plugins/custom/process-host-perfdata-log.pl $TIMET$
     }
In /opt/monitor/etc/naemon.cfg service_perfdata_file_processing_command and host_perfdata_file_processing_command has to be changed to run those custom scripts:
 service_perfdata_file_processing_command=process-service-perfdata-log
 host_perfdata_file_processing_command=process-host-perfdata-log
In addition service_perfdata_file_template and host_perfdata_file_template can be changed to support sending more data to Elasticsearch. For instance, by adding $HOSTGROUPNAMES$ and $SERVICEGROUPNAMES$ macros logs can be separated better (it requires changes to Logstash filter config as well)
Restart naemon service:
 sudo systemctl restart naemon # CentOS/RHEL 7.x
 sudo service naemon restart # CentOS/RHEL 6.x
If FileBeat has been chosen, append below to filebeat.conf (adjust IP and PORT):
 filebeat.inputs:
 - type: log
   enabled: true
   paths:
     - /opt/monitor/var/service_performance.log
     - /opt/monitor/var/host_performance.log

 	tags: ["op5perflogs"]


 output.logstash:
   # The Logstash hosts
   hosts: ["LOGSTASH_IP:LOGSTASH_PORT"]
Restart FileBeat service:
  sudo systemctl restart filebeat # CentOS/RHEL 7.x
  sudo service filebeat restart # CentOS/RHEL 6.x
Kibana
At this moment there should be new index on the Elasticsearch node with performance data documents from OP5 Monitor.
Login to an Elasticsearch node and run: curl -XGET '127.0.0.1:9200/_cat/indices?v' Example output:
health status index                      pri rep docs.count docs.deleted store.size pri.store.size
green  open   auth                       5   0          7         6230      1.8mb          1.8mb
green  open   op5-perflogs-2018.09.14    5   0      72109            0     24.7mb         24.7mb
After a while, if there is no new index make sure that:
- Naemon is runnig on OP5 node
- Logstash service is running and there are no errors in: /var/log/logstash/logstash-plain.log
- Elasticsearch service is running an there are no errors in: /var/log/elasticsearch/elasticsearch.log
If the index has been created, in order to browse and visualize the data “index pattern” needs to be added to Kibana.
- After logging in to Kibana GUI go to Settings tab and add op5-perflogs-* pattern. Chose @timestamp time field and click Create.
- Performance data logs should be now accessible from Kibana GUI Discovery tab ready to be visualize.
The Grafana instalation
To install the Grafana application you should:
add necessary repository to operating system:
  [root@logserver-6 ~]# cat /etc/yum.repos.d/grafan.repo
  [grafana]
  name=grafana
  baseurl=https://packagecloud.io/grafana/stable/el/7/$basearch
  repo_gpgcheck=1
  enabled=1
  gpgcheck=1
  gpgkey=https://packagecloud.io/gpg.key https://grafanarel.s3.amazonaws.com/RPM-GPG-KEY-grafana
  sslverify=1
  sslcacert=/etc/pki/tls/certs/ca-bundle.crt
  [root@logserver-6 ~]#
install the Grafana with following commands:
  [root@logserver-6 ~]# yum search grafana
  Loaded plugins: fastestmirror
  Loading mirror speeds from cached hostfile
   * base: ftp.man.szczecin.pl
   * extras: centos.slaskdatacenter.com
   * updates: centos.slaskdatacenter.com
  =========================================================================================================== N/S matched: grafana ===========================================================================================================
  grafana.x86_64 : Grafana
  pcp-webapp-grafana.noarch : Grafana web application for Performance Co-Pilot (PCP)

    Name and summary matches only, use "search all" for everything.

  [root@logserver-6 ~]# yum install grafana
to run application use following commands:
  [root@logserver-6 ~]# systemctl enable grafana-server
  Created symlink from /etc/systemd/system/multi-user.target.wants/grafana-server.service to /usr/lib/systemd/system/grafana-server.service.
  [root@logserver-6 ~]#
  [root@logserver-6 ~]# systemctl start grafana-server
  [root@logserver-6 ~]# systemctl status grafana-server
  ● grafana-server.service - Grafana instance
     Loaded: loaded (/usr/lib/systemd/system/grafana-server.service; enabled; vendor preset: disabled)
     Active: active (running) since Thu 2018-10-18 10:41:48 CEST; 5s ago
       Docs: http://docs.grafana.org
   Main PID: 1757 (grafana-server)
     CGroup: /system.slice/grafana-server.service
             └─1757 /usr/sbin/grafana-server --config=/etc/grafana/grafana.ini --pidfile=/var/run/grafana/grafana-server.pid cfg:default.paths.logs=/var/log/grafana cfg:default.paths.data=/var/lib/grafana cfg:default.paths.plugins=/var...

   [root@logserver-6 ~]#
To connect the Grafana application you should:
define the default login/password (line 151;154 in config file)
  [root@logserver-6 ~]# cat /etc/grafana/grafana.ini
  .....
  148 #################################### Security ####################################
  149 [security]
  150 # default admin user, created on startup
  151 admin_user = admin
  152
  153 # default admin password, can be changed before first start of grafana,  or in profile settings
  154 admin_password = admin
  155
….. - restart grafana-server service:
		[root@logserver-6 ~]# systemctl restart grafana-server

- Login to Grafana user interface using web browser: *http://ip:3000*
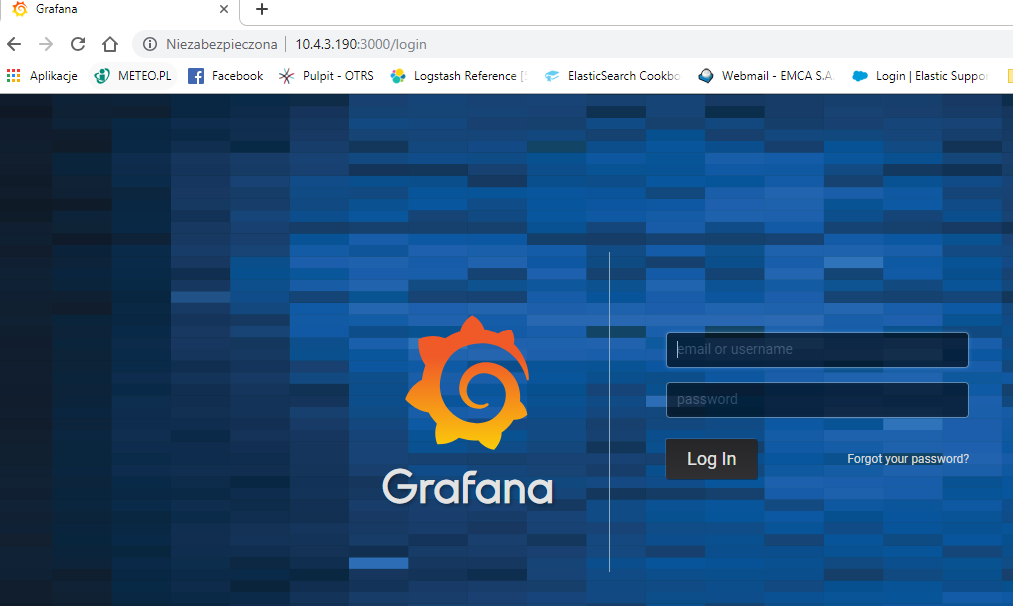
- use login and password that you set in the config file.
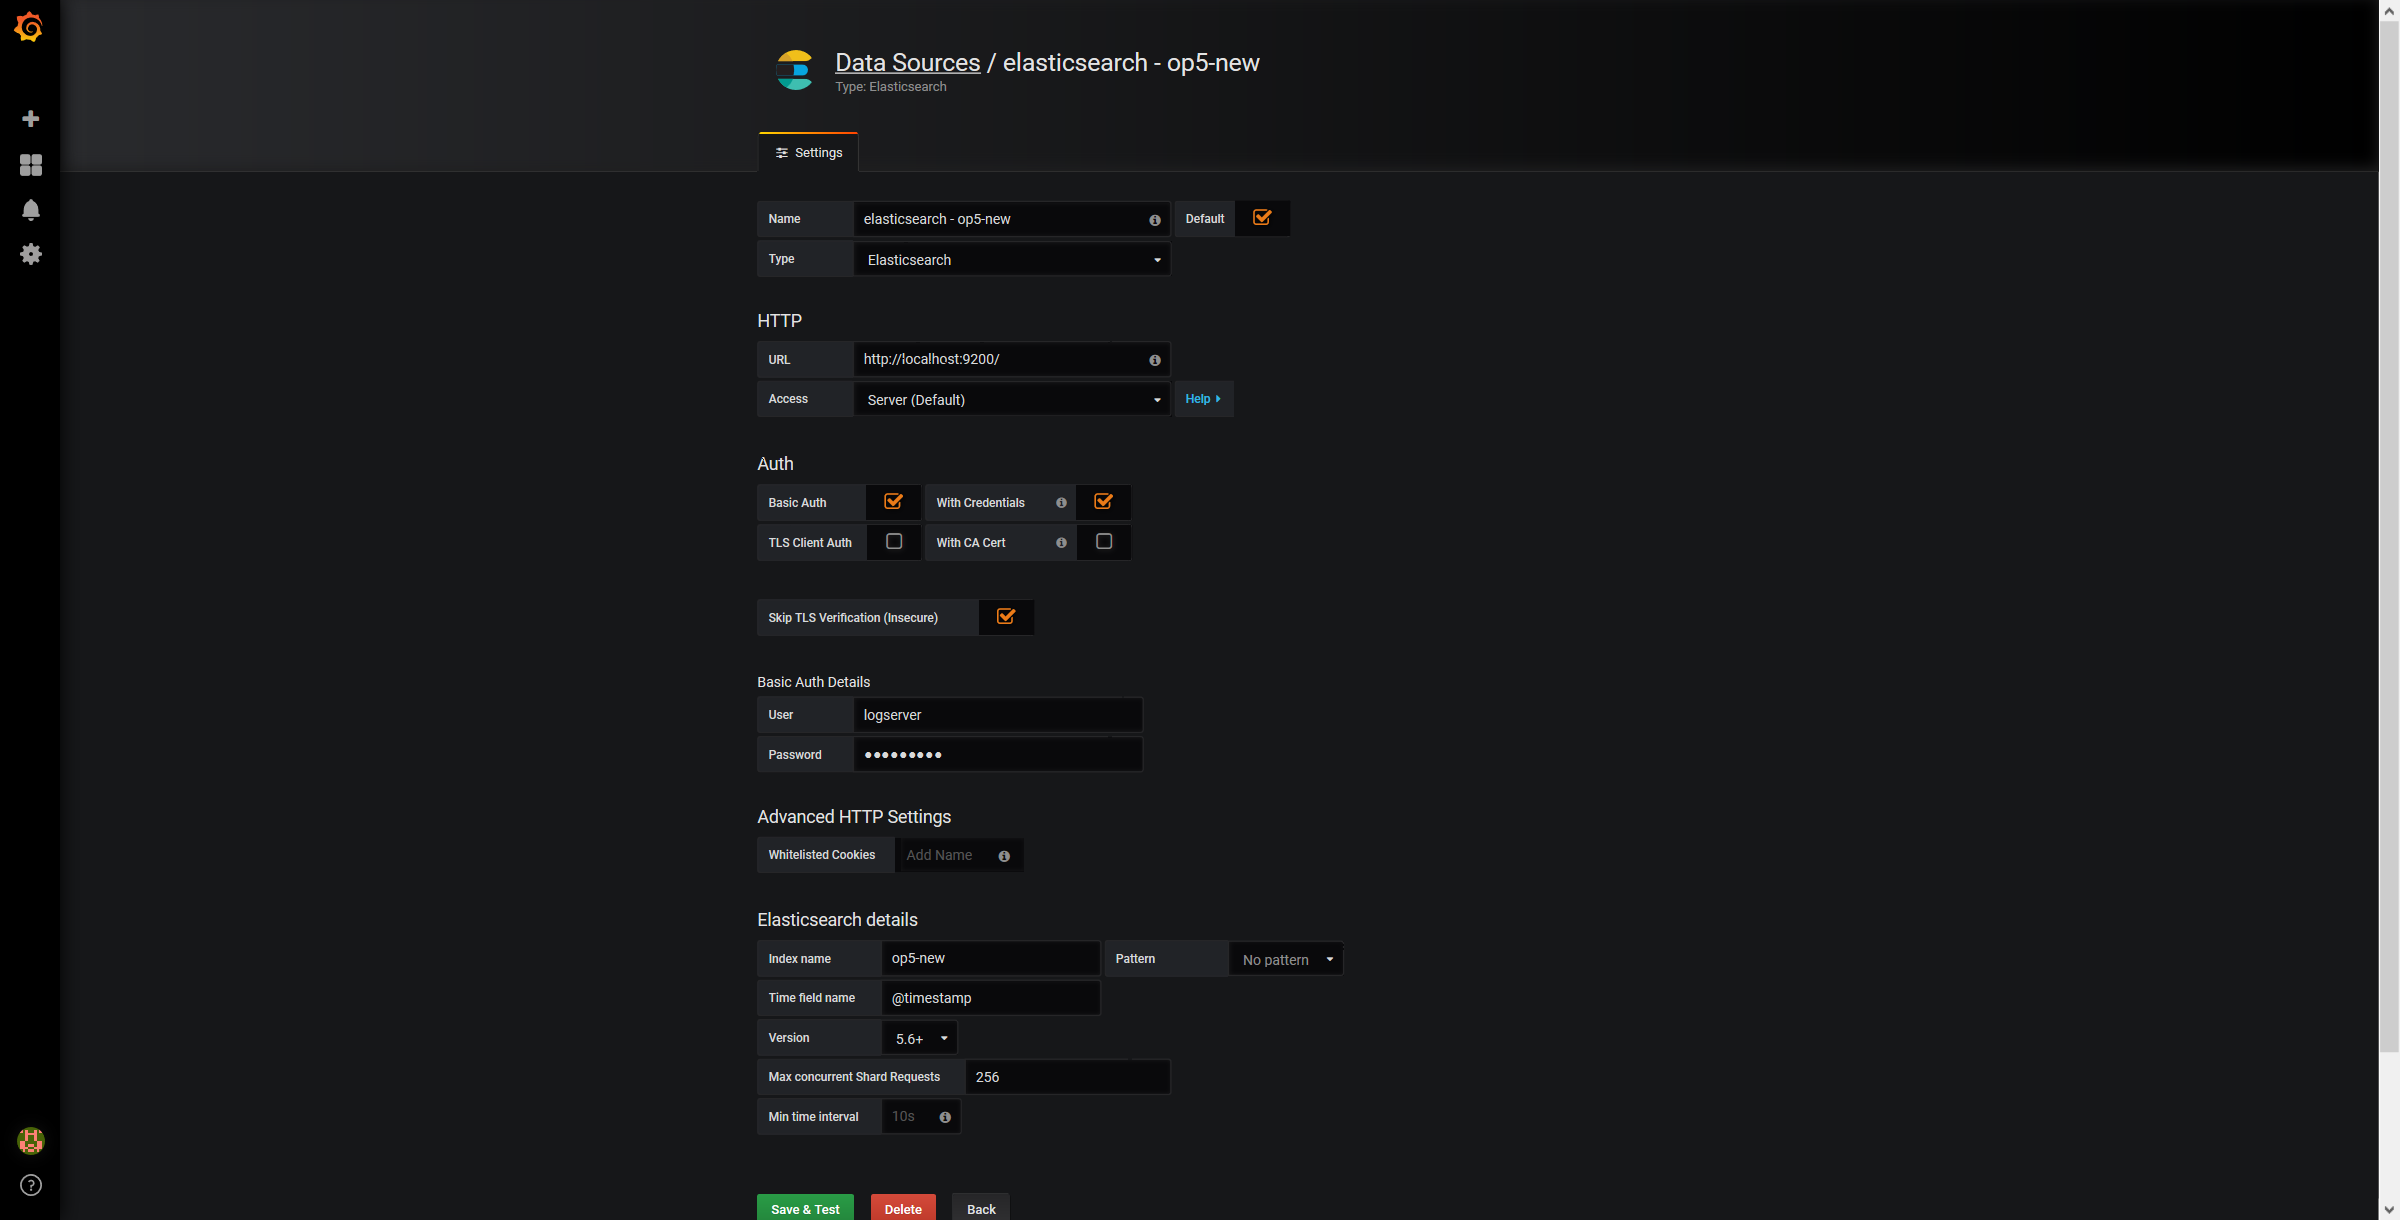
Use below example to set conection to Elasticsearch server:
The Beats configuration
Kibana API
Reference link: https://www.elastic.co/guide/en/kibana/master/api.html
After installing any of beats package you can use ready to use dashboard related to this beat package. For instance dashboard and index pattern are available in /usr/share/filebeat/kibana/6/ directory on Linux.
Before uploading index-pattern or dashboard you have to authorize yourself:
Set up login/password/kibana_ip variables, e.g.:
 login=logserver
 password=my_password
 kibana_ip=10.4.11.243
Execute command which will save authorization cookie:
curl -c authorization.txt -XPOST -k "https://${kibana_ip}:5601/login" -d "username=${username}&password=${password}&version=6.2.3&location=https%3A%2F%2F${kibana_ip}%3A5601%2Flogin"
Upload index-pattern and dashboard to Kibana, e.g.:
curl -b authorization.txt -XPOST -k "https://${kibana_ip}:5601/api/kibana/dashboards/import" -H 'kbn-xsrf: true' -H 'Content-Type: application/json' -d@/usr/share/filebeat/kibana/6/index-pattern/filebeat.json
curl -b authorization.txt -XPOST -k "https://${kibana_ip}:5601/api/kibana/dashboards/import" -H 'kbn-xsrf: true' -H 'Content-Type: application/json' -d@/usr/share/filebeat/kibana/6/dashboard/Filebeat-mysql.json
When you want to upload beats index template to Ealsticsearch you have to recover it first (usually you do not send logs directly to Es rather than to Logstash first):
/usr/bin/filebeat export template --es.version 6.2.3 >> /path/to/beats_template.json
After that you can upload it as any other template (Access Es node with SSH):
curl -XPUT "localhost:9200/_template/op5perfdata" -H'Content-Type: application/json' -d@beats_template.json
Wazuh integration
OP5 Log Analytics can integrate with the Wazuh, which is lightweight agent is designed to perform a number of tasks with the objective of detecting threats and, when necessary, trigger automatic responses. The agent core capabilities are:
- Log and events data collection
- File and registry keys integrity monitoring
- Inventory of running processes and installed applications
- Monitoring of open ports and network configuration
- Detection of rootkits or malware artifacts
- Configuration assessment and policy monitoring
- Execution of active responses
The Wazuh agents run on many different platforms, including Windows, Linux, Mac OS X, AIX, Solaris and HP-UX. They can be configured and managed from the Wazuh server.
Deploying Wazuh Server
https://documentation.wazuh.com/current/installation-guide/installing-wazuh-server/index.html#
Deploing Wazuh Agent
https://documentation.wazuh.com/current/installation-guide/installing-wazuh-agent/index.html